
Hyperkalemia ECG Changes
A high serum potassium can change the ECG (EKG) in a recognized order: tall, peaked T waves and a short QT interval first, then a longer PR interval and fading P waves, then a wider QRS, and at the end a sine wave. The ECG is an insensitive guide, though, and many people with a high potassium show none of it.
The ECG changes of hyperkalemia, in order
The classic teaching runs from the T wave to the P wave and PR interval, then to the QRS, then to the rhythm itself.6 The series was defined in experimental settings,55 and in patients the changes do not always come, or come in this order5 (see how reliable the ECG is).
-
Normal, for comparison
A normal tracing from the same synthetic heart, to set the stages below against: a small, rounded T wave, an upright P wave before every QRS and a narrow QRS.
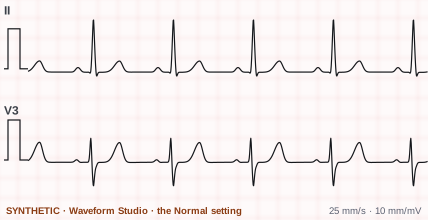
Synthetic. Drawn by Waveform Studio (the Normal setting), leads II and V3, to show the change. Not a patient recording. -
First
Peaked T waves and a short QT
As potassium rises, the T wave often, but not always, becomes peaked.1 Levis 2013 describes the first findings as tall, peaked T waves with a shortened QT interval.4 A study grading the change looked for new T waves that were peaked and symmetric.5
Level given by the AHA statement: 5.5 to 6.5 mmol/L.1
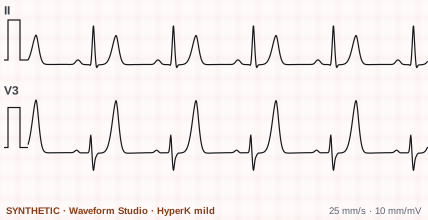
Synthetic. Drawn by Waveform Studio (HyperK mild), leads II and V3, to show the change. Not a patient recording. -
Then
Longer PR, fading P waves, wider QRS
The PR interval lengthens1 and the P waves flatten and are lost.45 The QRS widens.1
Levels given by the AHA statement: the PR lengthens at 6.5 to 7.5 mmol/L,1 the QRS widens at 7.0 to 8.0.1
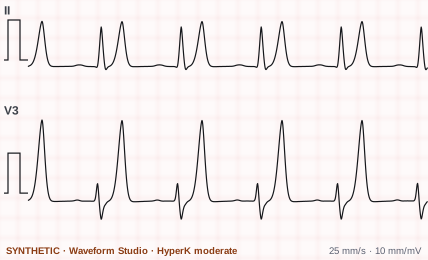
Synthetic. Drawn by Waveform Studio (HyperK moderate), leads II and V3, to show the change. Not a patient recording. -
Last
Slow rhythms and the sine wave
The rhythm can slow,1 which the AHA statement puts down to the very long PR and QRS.1 The statement lists a sinoventricular rhythm among the rhythms of severe hyperkalemia,1 and the experimental series Montague 2008 describes ends with the loss of sinoatrial conduction and a wide-complex sine-wave ventricular rhythm.5 The case Levis reports shows a junctional escape rhythm with no P waves and peaked T waves.4 The widening QRS ends in a sine wave.4 Ventricular fibrillation and asystole can follow.1
Level given by the AHA statement: above 10 mmol/L.1
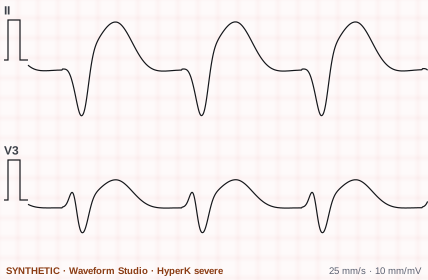
Synthetic. Drawn by Waveform Studio (HyperK severe), leads II and V3, to show the change. Not a patient recording.
The four strips are synthetic: Waveform Studio's Normal and HyperK settings, drawn on the same scale so the stages can be compared. You can move between them yourself in Waveform Studio: open the Lytes tab and choose HyperK mild, moderate or severe.
Potassium levels and the ECG
The 2017 AHA monitoring statement classifies hyperkalemia as mild, moderate or severe,1 and gives a level for each change. These are the statement's figures, and it adds two warnings: changes do not usually show until the level is above 6.5 mmol/L,1 and they vary between people and may not be predictable.1
| Change | Level in the AHA statement |
|---|---|
| Peaked T waves | 5.5 to 6.5 mmol/L |
| PR interval lengthens | 6.5 to 7.5 mmol/L |
| QRS widens | 7.0 to 8.0 mmol/L |
| Sine wave, VF, asystole or pulseless electrical activity | Above 10 mmol/L |
mmol/L and mEq/L are the same number for potassium. Some of the papers below use one, some the other.
What to look for on the EKG
Each change, with the dictionary entry for the wave or interval it affects.
- Peaked T wavesTall, pointed and symmetric T waves.45 No height marks them as peaked: Montague 2008 measured the T waves and could set no threshold.5
- A short QT intervalThe QT interval shortens.45
- A long PR interval, then fading P wavesThe PR interval lengthens1 and the P waves lose height until they are gone.54
- A wide QRSThe QRS complex widens.1 It was the most common finding in Durfey 2017, in 43% of patients, ahead of peaked T waves in 30%.6
- Slow and escape rhythmsBradycardia,1 and the escape rhythms the traditional sequence places after the P waves are lost:6 a junctional rhythm, which Varga 2019 saw only when the potassium was high,7 or a ventricular escape rhythm.6
- ST-segment changesNonspecific ST-segment changes are among the most common findings,1 and ST elevation can appear with the peaked T waves and the wide QRS.1 The AHA ECG standard names electrolyte abnormalities, of calcium and potassium above all, among the causes of primary repolarization abnormalities.3
- Bundle branch blocksLess typical: bundle branch blocks that come and go with the heart rate.5
- The sine wave, VF and asystoleThe end of the sequence: a sine wave pattern, ventricular fibrillation and asystole or pulseless electrical activity.1
How reliable is the ECG for hyperkalemia?
Less than the neat sequence suggests. Diagnosis usually rests on the laboratory,4 and three studies of patients with a high potassium found the ECG often unchanged.
| Study | Who | What it found |
|---|---|---|
| Montague 2008 | 90 admitted patients, potassium 6.0 or more | The ECG was insensitive for diagnosing hyperkalemia,5 with sensitivities from 0.18 to 0.52 depending on the criteria.55 Changes grew more likely as the potassium rose.5 |
| Durfey 2017 | 188 patients, potassium 6.5 mEq/L or more | 71% had at least one ECG finding of hyperkalemia.6 The studies it cites found none in 50 to 64% of patients at that level.6 |
| Varga 2019 | 135 patients with a high potassium, 170 with a normal one | 46% of the first group had some ECG change suggesting hyperkalemia, and so did 24% of the second.77 Its conclusion: the ECG is not a reliable tool for the diagnosis.7 |
Which changes went with trouble
In Durfey 2017, every patient who had an adverse event within six hours had at least one ECG finding of hyperkalemia first.66 Those events were more likely with a wide QRS, a heart rate under 50 or a junctional rhythm,66 and peaked T waves showed no significant link to them.6 Arrhythmia and cardiac arrest have been reported with no peaked T waves before them.6
Look-alikes
ST elevation that is not an infarction
The Fifth Universal Definition says ST elevation is not specific to myocardial infarction2 and lists hyperkalaemia among the non-cardiac conditions that cause it.2 Montague 2008 describes ST elevation in hyperkalemia mimicking an acute infarction.5
Tall T waves with a normal potassium
Ischemia and metabolic acidosis have both been linked to ST and T-wave changes like those of hyperkalemia.55 In Varga 2019, 24% of patients with a normal potassium had an ECG change suggesting hyperkalemia,77 and peaked T waves, on 18.4% of the severely hyperkalemic patients' ECGs, were on 4.7% of the normal ones.77
Hyperkalemia vs hypokalemia on the ECG
The 2017 AHA monitoring statement describes the ECG of both. Side by side:
| High potassium | Low potassium | |
|---|---|---|
| T wave | Tall and peaked1 | Broad1 |
| ST segment | Nonspecific changes,1 sometimes elevation1 | Depressed1 |
| U wave | Not named | Prominent U waves1 |
| PR and QRS | Both lengthen11 | Not described as such; first- or second-degree AV block is among the arrhythmias named1 |
More in the dictionary: hyperkalemia and hypokalemia.
Read real ECGs next
The strips above are drawn for clarity. Practice on real 12-lead ECGs and rhythm strips, with calipers and a magnifier, and catch rhythm changes on a live bedside monitor in Telemetry Watch. Pro adds the 12-Lead and STEMI Workups, the 12-Lead Report, True Sim, the rhythm simulator built only from real patient recordings, and ARIA, which marks P, QRS, ST and T on any beat you click.
Hyperkalemia ECG and EKG questions
What are the ECG changes of hyperkalemia?
In the order usually taught: tall, peaked T waves and a short QT interval,4 then a longer PR interval and flattened or lost P waves,4 then a wider QRS complex, ending in a sine wave pattern.4 Slow rhythms,1 escape rhythms,6 ST-segment changes,1 ventricular fibrillation and asystole can also be seen.1
At what potassium level does the EKG change?
The 2017 AHA monitoring statement gives peaked T waves at 5.5 to 6.5 mmol/L,1 a longer PR interval at 6.5 to 7.5,1 a wider QRS at 7.0 to 8.0,1 and a sine wave, VF or asystole above 10.1 It also says changes do not usually appear until the level is above 6.5 mmol/L,1 and that they vary between people and may not be predictable.1
Can hyperkalemia have a normal ECG?
Yes. Studies cited by Durfey 2017 found no ECG findings of hyperkalemia in 50 to 64% of patients with a potassium of 6.5 mEq/L or more,6 Montague 2008 found the ECG insensitive for diagnosing hyperkalemia,5 and in Varga 2019 more than half of the patients with hyperkalemia had no ECG change suggesting it.7
What do peaked T waves look like?
Tall, pointed and symmetric.45 Peaked T waves are not specific to hyperkalemia: in Varga 2019 they were on 18.4% of the ECGs from severely hyperkalemic patients and on 4.7% of those from patients whose potassium was normal.77
Can hyperkalemia cause ST elevation?
Yes. The Fifth Universal Definition of Myocardial Infarction lists hyperkalaemia among the conditions other than infarction that can show ST-segment elevation,2 and Montague 2008 describes ST elevations mimicking acute myocardial infarction.5
What is the sine wave pattern?
The last of the classic changes: the QRS keeps widening until the tracing takes on a sine wave shape.4 The AHA monitoring statement places it, with VF and asystole, at potassium levels above 10 mmol/L.1
How do hyperkalemia and hypokalemia look different on the ECG?
High potassium peaks the T wave, lengthens the PR interval and widens the QRS.111 In the AHA monitoring statement, low potassium broadens the T wave, depresses the ST segment and brings prominent U waves.1
Are the strips on this page real patients?
No. They are synthetic, drawn by EKGLab's Waveform Studio to show each change clearly. The papers cited on this page describe recordings from real patients.
Is this page clinical advice?
No. It is a study guide that reports what published sources say about the ECG in hyperkalemia. A potassium level is measured in the laboratory, and clinical decisions follow your own institution's protocols.
Sources
Point at any number on this page, or tap it, to read the source's own words and where they are. No manufacturer's material or general website is used.
Standards and statements
- Sandau KE, Funk M, Auerbach A, et al. Update to practice standards for electrocardiographic monitoring in hospital settings: a scientific statement from the American Heart Association. Circulation. 2017;136(19):e273-e344. Read the sourceThe AHA statement on bedside and telemetry monitoring. Its section on potassium gives the order of the changes with the levels it attaches to each.
- Mills NL, Newby LK, Zaman S, et al; ESC/ACC/AHA/WHF Universal Definition Document Advisory Group. Fifth universal definition of myocardial infarction (2026). Glob Heart. 2026;21(1):64. Read the sourceThe ESC, ACC, AHA and WHF definition of myocardial infarction. Used here only for ST elevation that is not an infarction.
- Rautaharju PM, Surawicz B, Gettes LS, et al. AHA/ACCF/HRS recommendations for the standardization and interpretation of the electrocardiogram: part IV: the ST segment, T and U waves, and the QT interval. Circulation. 2009;119(10):e241-e250. Read the sourceThe standard for the ST segment, the T and U waves and the QT interval. Used here for what it says causes primary repolarization changes.
Peer-reviewed papers
- Levis JT. ECG diagnosis: hyperkalemia. Perm J. 2013;17(1):69. Read the sourceA one-page teaching case with two 12-lead ECGs from one patient, before and after the potassium fell.
- Montague BT, Ouellette JR, Buller GK. Retrospective review of the frequency of ECG changes in hyperkalemia. Clin J Am Soc Nephrol. 2008;3(2):324-330. Read the sourceA review of 90 admitted patients with a potassium of 6.0 or more and an ECG within an hour of the blood draw.
- Durfey N, Lehnhof B, Bergeson A, et al. Severe hyperkalemia: can the electrocardiogram risk stratify for short-term adverse events? West J Emerg Med. 2017;18(5):963-971. Read the sourceA study of 188 patients with a potassium of 6.5 mEq/L or more, each ECG read by two emergency physicians who did not know the level.
- Varga C, Kálmán Z, Szakáll A, et al. ECG alterations suggestive of hyperkalemia in normokalemic versus hyperkalemic patients. BMC Emerg Med. 2019;19:33. Read the sourceCompared the ECGs of 135 patients with a high potassium and 170 with a normal one.