EKG Foundations
How to read an ECG from the ground up: the waves and intervals, the grid they sit on, and a step-by-step method for naming the common rhythms.
The electrocardiogram (ECG, or EKG) is a recording of the heart's electrical activity, captured at the surface of the body and displayed on calibrated paper or a monitor. With every heartbeat, an electrical impulse spreads through the heart in a fixed sequence; as the heart muscle is activated (depolarizes) and then recovers (repolarizes), electrodes on the skin detect the resulting voltage changes and plot them as a series of waves. It is one of the most valuable tests in medicine. Quick, painless, and inexpensive, it can still reveal the heart's rate, rhythm, and conduction, along with signs of ischemia, injury, and many other conditions.
To the untrained eye an ECG looks complicated, but it is built from only a handful of waves, and in a normal heartbeat they appear in the same order every time; when that order breaks down, the change is itself a clue to the rhythm. Each wave corresponds to a specific electrical event in the heart, with a characteristic shape and a defined normal range. Once you understand what produces each wave and how to measure it, interpretation becomes a systematic, repeatable process rather than guesswork. This page builds those fundamentals from the ground up: the conduction system, the waves and intervals, the grid they are drawn on, and a step-by-step method for reading the common rhythms.
The conduction system
A heartbeat is an electrical wave that sweeps through the heart in a fixed order. The ECG is simply a recording of that wave from the body surface.
Every heartbeat starts as an electrical impulse, and the heart has its own built-in wiring to carry it. The signal follows the same path in the same order every time: it begins in the sinoatrial (SA) node in the right atrium and spreads across the atria, then pauses briefly at the AV node so the atria can finish emptying into the ventricles. From there it travels down the bundle of His, through the right and left bundle branches, and into the Purkinje fibers, which fire both ventricles almost at once. Because that sequence is so orderly, each step leaves its own fingerprint on the ECG, a distinct wave that appears in the same order on every beat.
The SA node fires fastest, so it normally sets the pace, a rhythm we call "sinus rhythm." If it ever fails, slower backup pacemakers further down the pathway can step in to keep the heart beating.
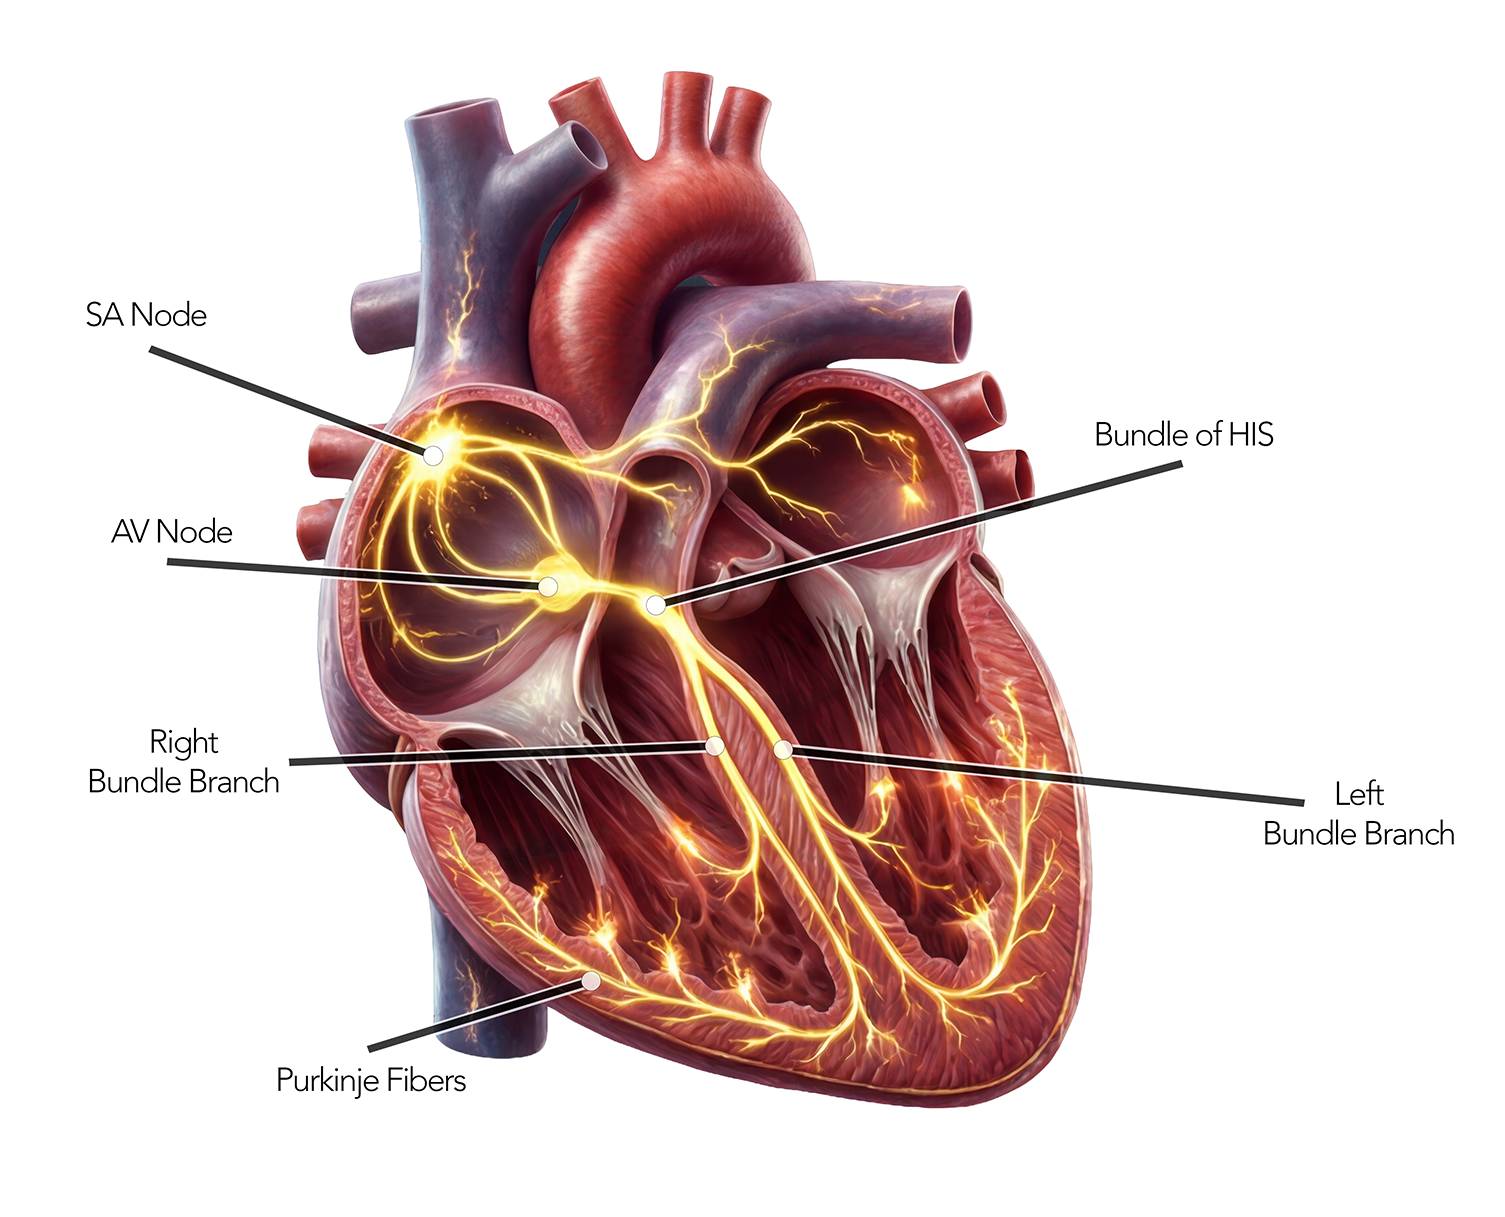
- SA node: the pacemakerSpontaneously fires ~60–100×/min in the right atrium. Sets the heart rate.
- Atria depolarize → P waveThe impulse spreads across both atria, producing the P wave.
- AV node: the gatekeeperDeliberately delays the impulse (~0.1 s) so the atria can finish emptying. This pause, with the impulse's passage through the bundle of His, makes up most of the flat PR segment.
- His bundle & bundle branchesThe signal speeds into the ventricular septum via the right and left bundle branches.
- Purkinje fibers → QRSFast fibers fire both ventricles almost simultaneously, the sharp QRS complex.
Leads and Einthoven's triangle
Electrodes are the sensors on the skin. A lead is a point of view: the voltage measured from a negative pole to a positive pole. Ten electrodes give the twelve leads of a standard ECG, and one rule explains which way each wave of depolarization points.1
An electrode is a sticky sensor on the skin. A lead is what the machine works out from the electrodes: the difference in voltage between a positive end and a negative end. Think of each lead as a line of sight that looks at the heart from its positive end. Four electrodes go on the limbs and six go across the chest, and from those the machine builds twelve leads.
The stickers and their wires are often called "leads" too, which is where the confusion starts. Strictly, the sticker is an electrode and the lead is the view. A 12-lead ECG has twelve views, but only ten electrodes on the body, and only nine of them (RA, LA, LL and V1 to V6) measure the heart.
Four on the limbs
- RARight arm On the arm, anywhere below the shoulder.
- LALeft arm On the arm, anywhere below the shoulder.
- LLLeft leg On the leg, anywhere below the hip.
- RLRight leg The ground (neutral) electrode. It cuts down electrical interference and is not part of any lead.
Six across the chest
- V1Fourth intercostal space at the right edge of the sternum.
- V2Fourth intercostal space at the left edge of the sternum.
- V3Midway between V2 and V4, so place V4 first.
- V4Fifth intercostal space on the left midclavicular line.
- V5Level with V4 on the left anterior axillary line (the front fold of the armpit).
- V6Level with V4 on the left midaxillary line (straight down from the middle of the armpit).
Right and left always mean the patient's right and left. Each intercostal space is the gap just below the rib with the same number.
Now watch the leads at work. Einthoven's triangle puts the right arm, left arm and left leg at the corners of a triangle with the heart in the middle. Each side is one lead, running from its negative electrode to its positive one. Watch a whole heartbeat pass through it, then drag the arrow to turn the heart's main direction and see what each lead draws. Switch to One wave to follow a single wave of depolarization on its own.
The augmented leads: aVR, aVL and aVF
The three sides of the triangle look at the heart from three directions, and that leaves gaps. The augmented leads fill them using the same three limb electrodes, with no extra stickers. Each one takes a single limb electrode as its positive end and compares it with the average of the other two. Averaging two electrodes makes a point halfway between them, so each augmented lead looks along a line from the middle of one side of the triangle, through the heart, to the opposite corner.
The names spell it out: a for augmented, V for voltage (or vector), and R, L or F for the right arm, left arm or foot. "Augmented" because wiring them this way draws the wave half as tall again (1.5 times) as the older method, which compared the limb with the average of all three limb electrodes.1
Standard limb leads
Each compares two limb electrodes. These are the three sides of the triangle.
- Iright arm (−) to left arm (+)0°
- IIright arm (−) to left leg (+)+60°
- IIIleft arm (−) to left leg (+)+120°
Augmented limb leads
Each compares one limb electrode (the positive end) with the average of the other two.
- aVRpositive at the right arm−150°
- aVLpositive at the left arm−30°
- aVFpositive at the left leg (foot)+90°
Chest leads
Each compares its chest electrode (the positive end) with the average of the three limb electrodes.
- V1, V2over the right side of the heart and the septum
- V3, V4over the front of the heart
- V5, V6over the left side of the heart
The six limb leads look at the heart in the frontal plane, as if you were facing the patient; the angles above are their directions in that plane, measured from lead I, with positive angles turning clockwise, toward the feet. The six chest leads look at it in the horizontal plane, like a slice across the chest. The same rule applies to every one of them: depolarization moving toward the positive end is up. Repolarization works the other way round, which is why a normal T wave usually points the same way as its QRS.1
Anatomy of a heartbeat
Each part of the beat, what it is, and exactly where it sits on a real Lead II tracing. Colours match Waveform Studio; normal values follow the AHA/ACCF/HRS standardization series.34567
P wave
Atrial depolarization
The electrical wave spreading across the right then left atrium, just before they squeeze. A small, smooth, rounded bump.
PR segment & interval
AV node delay
The flat line after the P wave is mostly the AV node holding the impulse back so the atria can finish filling the ventricles; the impulse is also crossing the bundle of His and the bundle branches, which are too small to show on the ECG. The PR interval spans the P wave start to the QRS start.
QRS complex
Ventricular depolarization
Both ventricles fire nearly together, driven by the fast Purkinje fibers, a tall, narrow spike. A Q is the first downward deflection, R the upward, S the downward after R.
J point
QRS–ST junction
The exact point where the QRS ends and the ST segment begins. ST elevation or depression is measured here, as the height of the J point above or below the baseline (the PR or TP segment).
ST segment
Plateau before recovery
The brief flat stretch when the ventricles are fully depolarized and holding, the action-potential "plateau." Normally level with the baseline; shifts here can signal injury.
T wave
Ventricular repolarization
The ventricles resetting electrically, ready for the next beat. A rounded, slightly asymmetric bump that, in lead II and most other leads, points the same way as the QRS. (In V2 and V3 an upright T wave after a mostly negative QRS is normal.)
U wave
Late repolarization
A small, often invisible bump after the T wave, best seen in V2 and V3. Its origin is uncertain: it may reflect late repolarization of the Purkinje fibers or mid-myocardial cells, or after-potentials from stretch of the ventricular wall. Prominent U waves are seen with low potassium and slow heart rates.
QT interval
Total ventricular activity
Start of the QRS to the end of the T wave, the whole span of ventricular depolarization and recovery. It shortens as heart rate rises, so it's rate-corrected (QTc).
Reading the paper
ECG paper uses the same grid everywhere: 1 mm small boxes inside 5 mm large boxes. What each box means depends on the paper speed and gain, which are almost always 25 mm/s and 10 mm/mV, so check the calibration pulse before you measure. Time runs left to right; voltage runs up and down.1
Now read it yourself. Click two points on the strip to drop a caliper; it reads the span in seconds across and millivolts up. Count the boxes between your points to see where the numbers come from.
Finding the heart rate
In a regular rhythm, the gap between two R waves gives the rate: count the large boxes between them and divide into 300 (for more precision, count the small boxes and divide into 1500). If the rhythm is irregular, count the QRS complexes in a 6-second strip (30 large boxes) and multiply by 10.1 Tap a rate below to see exactly what it looks like on the grid.
Reading a rhythm, step by step
The same checklist works on every strip. Run it in order and the diagnosis usually names itself.
- Rate Fast, slow, or normal?
60–100 bpm is normal. < 60 = bradycardia, > 100 = tachycardia. - Regularity Are the R–R intervals even?
Regular, regularly-irregular, or irregularly-irregular (think AFib). - P waves What is the atrial activity?
An upright, uniform P in lead II before every QRS = sinus origin. Sawtooth flutter waves = atrial flutter. No P waves on a wavy, fibrillating baseline = AFib. No visible P, or an inverted P just before or just after each QRS = junctional. - PR interval Constant and 120–200 ms?
Applies only when P waves are present. A long or lengthening PR points to AV block; a short PR (under 120 ms) suggests pre-excitation or a P wave arising near the AV junction. - QRS width Narrow or wide?
Under 0.12 s (3 small boxes) is narrow: the impulse came from above the ventricles. 0.12 s or wider is wide: a bundle branch block or a ventricular origin. - P : QRS relationship Does every P conduct?
Dropped or dissociated beats reveal the type of block.
Now try it yourself. Work each strip through the checklist under the monitor; pick the finding that fits to move on, and the rhythm is named only at the end.
Common rhythms at a glance
The basics in action.2789 Each card maps the rhythm back to the checklist above. See them live in the ecg_heartTrue Sim.
Normal sinus rhythm
60–100Regular · upright P before every QRS · PR 120–200 ms · narrow QRS.
The baseline. Everything else is judged against it.
Sinus bradycardia
< 60Same as sinus rhythm, just slow: normal P–QRS–T, rate under 60. (Some sources, including the 2018 ACC/AHA/HRS guideline, set the lower limit of normal at 50.)
Common in athletes and during sleep; can cause symptoms if too slow.
Sinus tachycardia
> 100Sinus rhythm sped up. Normal morphology, rate over 100, still regular.
Usually a physiological response to something else: fever, exercise, pain, anxiety or dehydration.
Atrial fibrillation
irregularNo discrete P waves · fibrillation waves (coarse, or so fine the baseline looks almost flat) · irregularly irregular R–R.
The atria quiver instead of contract, a major stroke-risk rhythm.
Atrial flutter
~150 at 2:1Sawtooth flutter waves (about 300/min), best seen in II, III and aVF. Conduction is usually 2:1 (ventricular rate about 150) or 4:1 (about 75); variable block makes the rhythm irregular.
A re-entry loop in the atrium; the ventricles follow at a fraction of the rate.
1° AV block
blockEvery P conducts, but the PR interval is long (> 200 ms) and fixed.
A slow gatekeeper, usually benign on its own.
2° AV block
blockMobitz I: PR lengthens beat by beat until a P wave is not followed by a QRS. Mobitz II: PR is constant in conducted beats, then a P wave suddenly fails to conduct. With 2:1 conduction (every other P blocked) the two cannot be told apart from the strip.
Mobitz II is the more dangerous: it can progress to complete block.
3° (complete) AV block
blockP waves and QRS complexes march independently: no P wave conducts, and the atrial rate is faster than the ventricular rate. The QRS comes from a slow, regular escape rhythm, either junctional (narrow, about 40–60 bpm) or ventricular (wide, about 20–40 bpm).
The atria and ventricles are fully disconnected; an escape rhythm keeps things going.
You have the foundations: the waves, the grid, and a system to read them. Now see them in motion. Continue to Rhythm Foundations to study these common rhythms in depth and practice reading real-world ECGs.
Continue to Rhythm FoundationsReferences
Normal values and definitions follow the AHA/ACCF/HRS Recommendations for the Standardization and Interpretation of the Electrocardiogram series and related guidelines.
- Kligfield P, Gettes LS, Bailey JJ, et al. Recommendations for the standardization and interpretation of the electrocardiogram: Part I: The electrocardiogram and its technology. Circulation. 2007;115(10):1306–1324. doi:10.1161/CIRCULATIONAHA.106.180200
- Mason JW, Hancock EW, Gettes LS, et al. … Part II: Electrocardiography diagnostic statement list. Circulation. 2007;115(10):1325–1332. doi:10.1161/CIRCULATIONAHA.106.180201
- Surawicz B, Childers R, Deal BJ, et al. … Part III: Intraventricular conduction disturbances. Circulation. 2009;119(10):e235–e240. doi:10.1161/CIRCULATIONAHA.108.191095
- Rautaharju PM, Surawicz B, Gettes LS, et al. … Part IV: The ST segment, T and U waves, and the QT interval. Circulation. 2009;119(10):e241–e250. doi:10.1161/CIRCULATIONAHA.108.191096
- Hancock EW, Deal BJ, Mirvis DM, et al. … Part V: Electrocardiogram changes associated with cardiac chamber hypertrophy. Circulation. 2009;119(10):e251–e261. doi:10.1161/CIRCULATIONAHA.108.191097
- Wagner GS, Macfarlane P, Wellens H, et al. … Part VI: Acute ischemia/infarction. Circulation. 2009;119(10):e262–e270. doi:10.1161/CIRCULATIONAHA.108.191098
- Kusumoto FM, Schoenfeld MH, Barrett C, et al. 2018 ACC/AHA/HRS Guideline on the Evaluation and Management of Patients With Bradycardia and Cardiac Conduction Delay. Circulation. 2019;140(8):e382–e482. doi:10.1161/CIR.0000000000000628
- Joglar JA, Chung MK, Armbruster AL, et al. 2023 ACC/AHA/ACCP/HRS Guideline for the Diagnosis and Management of Atrial Fibrillation. Circulation. 2024;149(1):e1–e156. doi:10.1161/CIR.0000000000001193
- Page RL, Joglar JA, Caldwell MA, et al. 2015 ACC/AHA/HRS Guideline for the Management of Adult Patients With Supraventricular Tachycardia. Circulation. 2016;133(14):e506–e574. doi:10.1161/CIR.0000000000000311
EKG Foundations is an educational reference for learning ECG interpretation. It is not medical advice and is not a substitute for clinical judgement or formal training.